The market has entered a high-risk but not overheated structure, with spot weakness, cautious derivatives, and waning institutional flows. For the uptrend to resume, renewed demand from both retail and institutional participants is essential, otherwise, this cooling phase may persist.

Overview
Bitcoin’s failure to hold above the $111K mark has marked a turning point in market structure, with multiple indicators reflecting cooling momentum. The 14-day RSI dropped notably, and spot volume fell below its statistical low band, underscoring a broad reduction in market engagement. Spot CVD also reversed into negative territory, confirming weakening demand in the spot market after last week’s brief recovery.
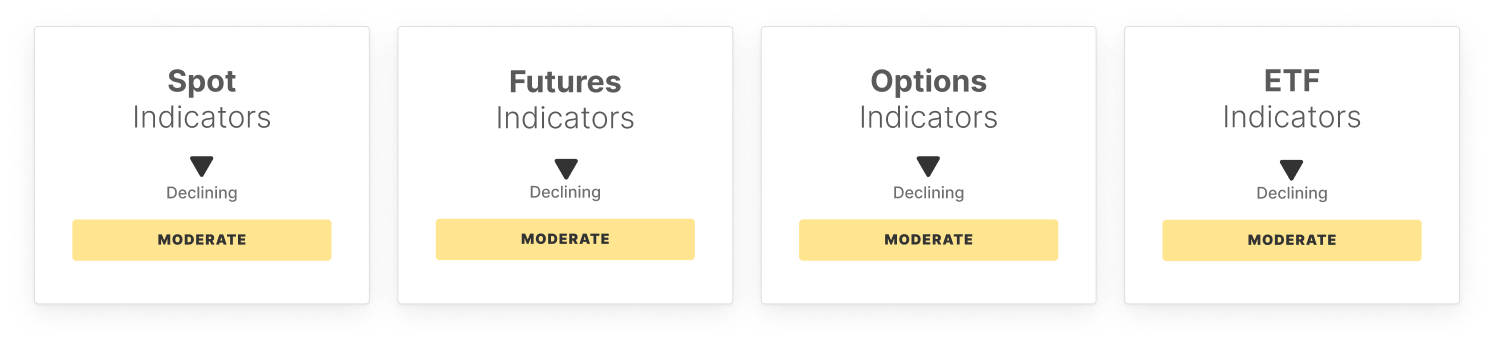
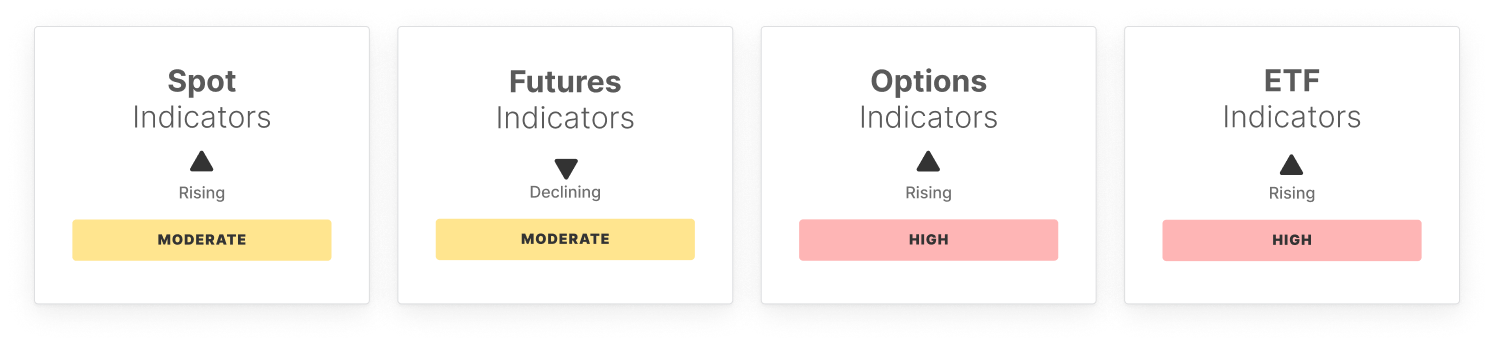
Futures market positioning softened as open interest declined, and long-side funding turned negative, indicating rising short pressure and lower risk appetite. Perpetual CVD also reversed, confirming a de-risking behavior among leverage traders. These trends suggest a tactical retreat rather than outright bearishness, as positioning remains above critical lows.
The options market held a mildly bullish bias, with 25-delta skew still negative and volatility spreads elevated, pointing to continued upside speculation despite reduced open interest. ETF metrics, however, painted a more cautious picture: netflows flipped sharply negative and trading volume declined toward statistical lows, signaling a retreat from institutional flows.
On-chain fundamentals reflected quiet network activity. Active address count and transfer volume both declined modestly, while total fee volume fell to near historical lows. Liquidity metrics stayed neutral, with realized cap change flat and hot capital share only slightly ticking higher — showing limited new inflows. The STH/LTH supply ratio remained low, highlighting long-term holder conviction.
Profitability metrics remain elevated but softened slightly. NUPL and percent of supply in profit pulled back from euphoric levels, while realized P/L ratio rose, showing that profit-taking continues, albeit more selectively.
Overall, the market has entered a high-risk but not overheated structure, with spot weakness, cautious derivatives, and waning institutional flows. For the uptrend to resume, renewed demand from both retail and institutional participants is essential, otherwise, this cooling phase may persist.
Off-Chain Indicators
On-Chain Indicators
Disclaimer: This report does not provide any investment advice. All data is provided for information and educational purposes only. No investment decision shall be based on the information provided here and you are solely responsible for your own investment decisions.
Exchange balances presented are derived from Glassnode’s comprehensive database of address labels, which are amassed through both officially published exchange information and proprietary clustering algorithms. While we strive to ensure the utmost accuracy in representing exchange balances, it is important to note that these figures might not always encapsulate the entirety of an exchange’s reserves, particularly when exchanges refrain from disclosing their official addresses. We urge users to exercise caution and discretion when utilizing these metrics. Glassnode shall not be held responsible for any discrepancies or potential inaccuracies.
Please read our Transparency Notice when using exchange data.