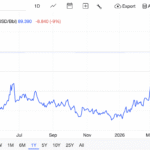
Bitcoin rallied sharply to $76k mid-week before a two-leg selloff to $67k, with price recovering toward $70k into the weekend. A shift away from overbought conditions and into a more balanced market phase is underway.

Overview
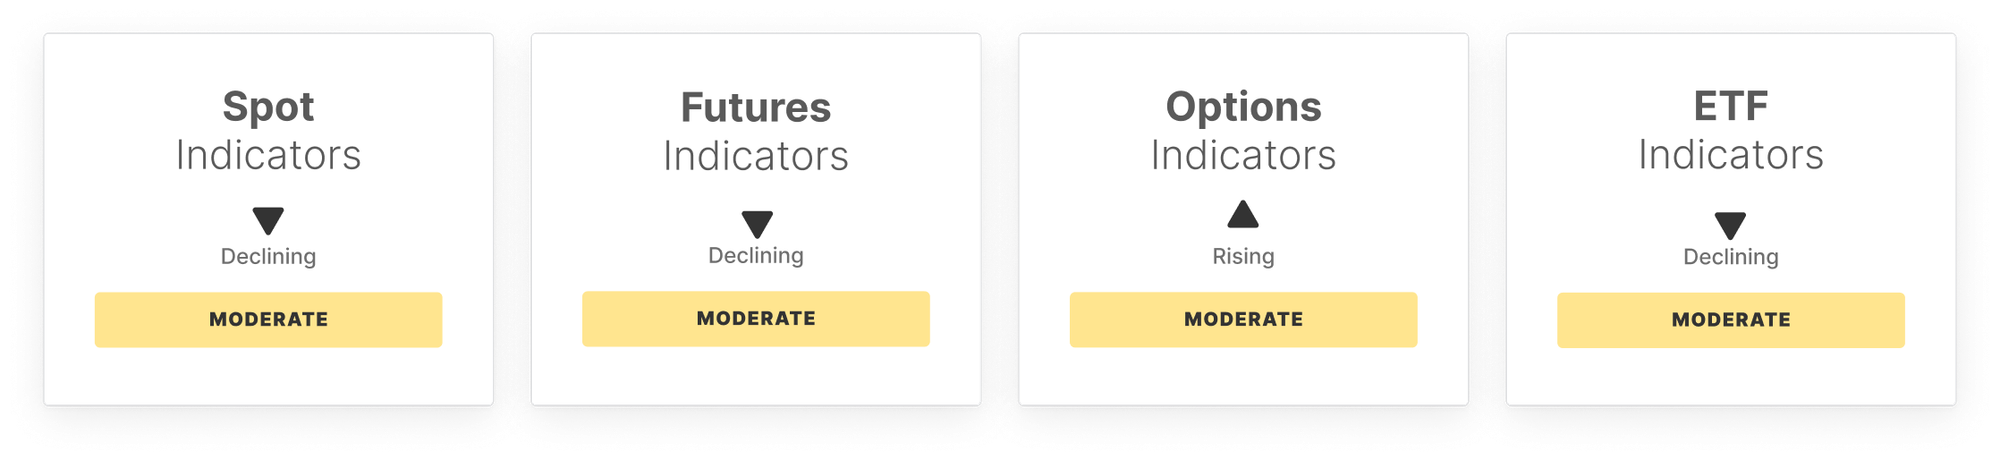
Spot market activity has softened, with volume declining and ETF inflows slowing materially week-on-week. The sharp reduction in institutional demand points to a loss of immediate spot-driven momentum, consistent with a more cautious, consolidative environment.
In derivatives, positioning has turned more defensive. CVD has reversed negative, highlighting renewed sell-side aggression, while open interest has edged lower and funding rates have flipped positive — suggesting modest leverage reduction alongside some rebuilding of long exposure, though conviction remains measured.
Options markets are stable, with open interest largely unchanged and volatility expectations subdued. A rise in 25-delta skew points to growing demand for downside protection, reflecting cautious sentiment among traders.
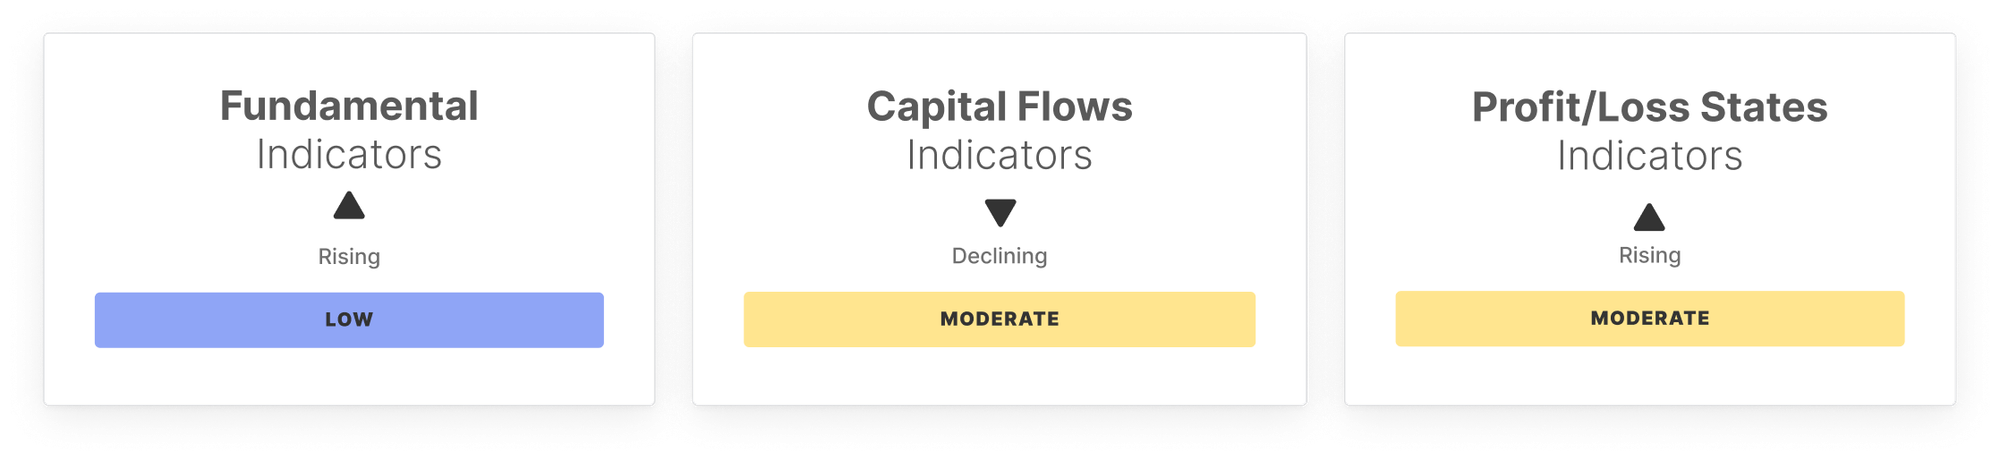
ETF positioning shows signs of cooling participation, with both net inflows and trading volumes declining. Profitability metrics have also compressed, with MVRV trending toward the lower end of its range, suggesting increased sensitivity to downside and a more defensive allocation backdrop.
On-chain activity remains subdued, with weak address activity and declining transfer volumes pointing to limited economic throughput. Capital flows show early signs of stabilization, while supply dynamics remain anchored by long-term holders and low hot capital participation.
In sum, the market appears to be transitioning into a consolidation phase, with softer activity, defensive positioning, and tentative signs of stabilization emerging across both spot and derivatives segments.
Off-Chain Indicators
On-Chain Indicators
Disclaimer: This report does not provide any investment advice. All data is provided for information and educational purposes only. No investment decision shall be based on the information provided here and you are solely responsible for your own investment decisions.
Exchange balances presented are derived from Glassnode’s comprehensive database of address labels, which are amassed through both officially published exchange information and proprietary clustering algorithms. While we strive to ensure the utmost accuracy in representing exchange balances, it is important to note that these figures might not always encapsulate the entirety of an exchange’s reserves, particularly when exchanges refrain from disclosing their official addresses. We urge users to exercise caution and discretion when utilizing these metrics. Glassnode shall not be held responsible for any discrepancies or potential inaccuracies.
Please read our Transparency Notice when using exchange data.