AI continues to dominate the conversation in crypto. From on-chain agents to auto-trading bots, innovation in this niche keeps expanding. One of the most watched tokens right now is VIRTUAL, the native asset of Virtuals Protocol. Its price is one of the most important indicators for the broader AI ecosystem. Whether you’re farming, trading, or just observing — the VIRTUAL price deserves your attention.
The Hype Around the Virtual Airdrop
One of the hottest airdrop farms at the moment is the Virtual Airdrop. Users are trading and staking AI agents, hoping to qualify for a juicy airdrop in just a few weeks. It’s gaining traction fast — especially among degens who know how to farm points and rewards. With growing interest and complex strategies forming, we may need to drop a full farming strategy guide soon. For now, just know that activity is ramping up, and rewards could be substantial for early participants.
Learn more about the Virtual Airdrop and Virgin points in our step-by-step airdrop guide.
Delta-Neutral Farming: Risk-Off With a Twist
Many airdrop farmers are taking a delta-neutral approach. Since you need some VIRTUAL tokens to play the airdrop game, some traders hedge by shorting VIRTUAL on Bybit. This method helps limit downside risk while staying eligible for farming rewards. If you plan to join in, keep the VIRTUAL price swings in mind. Proper hedging could be the difference between a profitable airdrop and an expensive mistake.
Reading the Charts: Technical Indicators on VIRTUAL
VIRTUAL traders use a mix of signals to predict price moves. While not all tools are necessary, some key indicators stand out.
Support and resistance levels are a great place to start. They reveal the balance between buyers and sellers and often hint at reversals.
Chart patterns help outline trend lines. These can signal upcoming candlestick moves and help plan entries.
Moving Averages, RSI, and MACD also come in handy. They give a wider view of the market trend and help traders guess where price might head next.
Improve your trading edge with our series of trading guides
Price Action Turning Bearish
The price has taken a hit lately. After slipping below a key resistance area around $2.00, VIRTUAL dropped further. Such breakouts below the support are usually considered bearish. VIRTUAL’s price is still down since the start of the year.
RSI: What the Momentum Says
RSI offers insight into market strength. It shows how strong recent price movements are — and whether a token might be overbought or oversold.
In the 4-hour time frame, VIRTUAL’s RSI is currently at 1.30. That’s extremely low and confirms the bearish momentum. If the RSI moves up and tests the 50 line, that could act as resistance.
Live Virtuals Protocol Price Stats
As of now, VIRTUAL is trading at $1.82. Its market cap stands at $1.21 billion. The trading volume over the last 24 hours has dropped by nearly 7%, with $89.53 million in trades.
There are currently 654.70 million VIRTUAL tokens in circulation. While trading is down, volume tends to return when price nears key support or resistance zones.
Understanding VIRTUAL Through Fundamental Analysis
Fundamentals help us evaluate the long-term potential of a token. For VIRTUAL, the focus is on demand growth, protocol development, and adoption.
Start with supply. A circulating supply of 654.70 million tokens is decent. Combine that with a $1.21 billion market cap, and you have a solid base.
Then there’s demand. This comes from user adoption, especially in airdrop farming and AI applications.
On-chain data, such as wallet activity and transaction count, can offer clues about demand spikes or drops. Keeping track of this data helps in forming longer-term price assumptions.
A Key Support Zone Is in Play
Currently, we’re seeing strong support around the $1.80 level. The price has bounced multiple times from this zone and there is a lot of liquidity here.
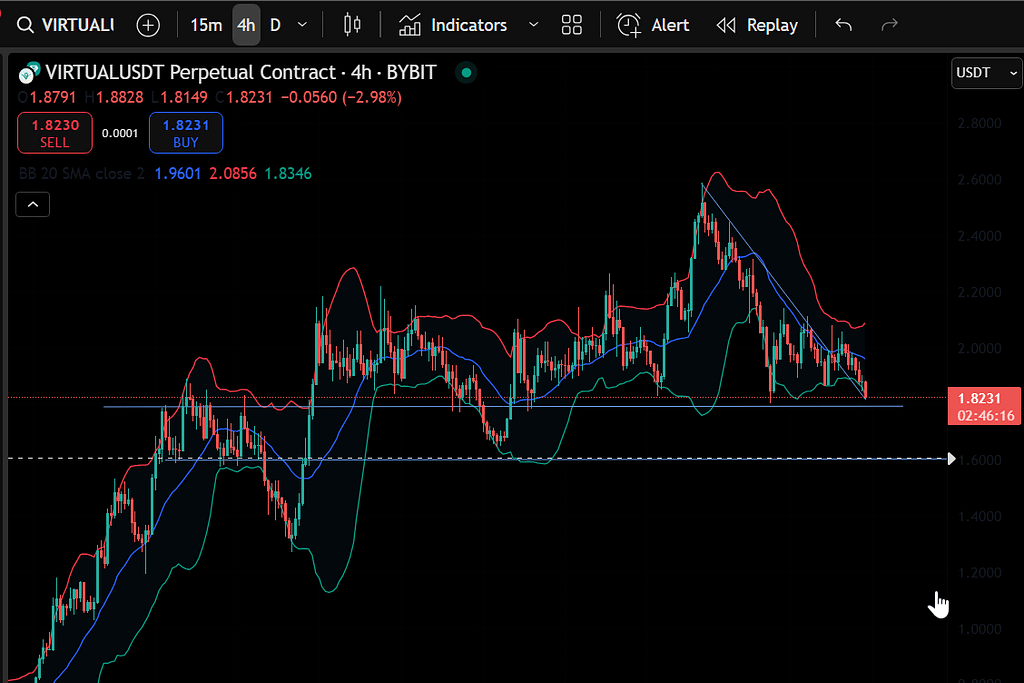
There’s also a breakout and retest of a diagonal resistance line, turning it into support.
Add in the lower Bollinger Band support, and you’ve got a confluence of signals. Plus, the bands are tightening — often a sign that a strong move is just around the corner.
What Really Moves the VIRTUAL Price?
In crypto, price is often driven by emotion and speculation. But in VIRTUAL’s case, there are specific forces at play:
- Supply and demand: As adoption grows, demand for the token can push the price up. If users stop interacting with the protocol, price often suffers.
- Protocol updates: New features or integrations can excite the market.
- Whale moves: A single big sell order can trigger a cascade of panic selling. Likewise, large buys can cause quick price spikes.
- Regulations: Government decisions, especially those around AI or DeFi, can impact sentiment and price.
My Current Trade on VIRTUAL
Right now, I’m going for a scalp long.
Here’s my setup:
- Entry: $1.82
- Stop-loss: $1.76
- Target: $2.03
If we reach that target, I’ll let 25% of the position ride, hoping for a secondary move up to $2.19.
The support at these levels feels strong. And with multiple indicators pointing to a potential bounce, it’s worth a shot. Of course, proper risk management is key.
Final Thoughts
The VIRTUAL price is one to watch, especially as AI continues to attract both investors and builders. Whether you’re trading, farming, or just curious — understanding the factors behind VIRTUAL’s movements can give you an edge.
With support building, airdrop hype growing, and chart signals aligning, we may be close to another big move.
Keep your eyes on the charts, manage your risks, and stay nimble.
AI crypto is not slowing down. Neither should you.
If you enjoyed this blog, check out our recent news on James Wynn and the Bitcoin price.
As always, don’t forget to claim your bonus below on Bybit. See you next time!