Understanding liquidity zones and stop hunts is crucial for Bitcoin traders. These concepts can help you anticipate market moves and protect your positions.
This is part 12 of a series of trading guides
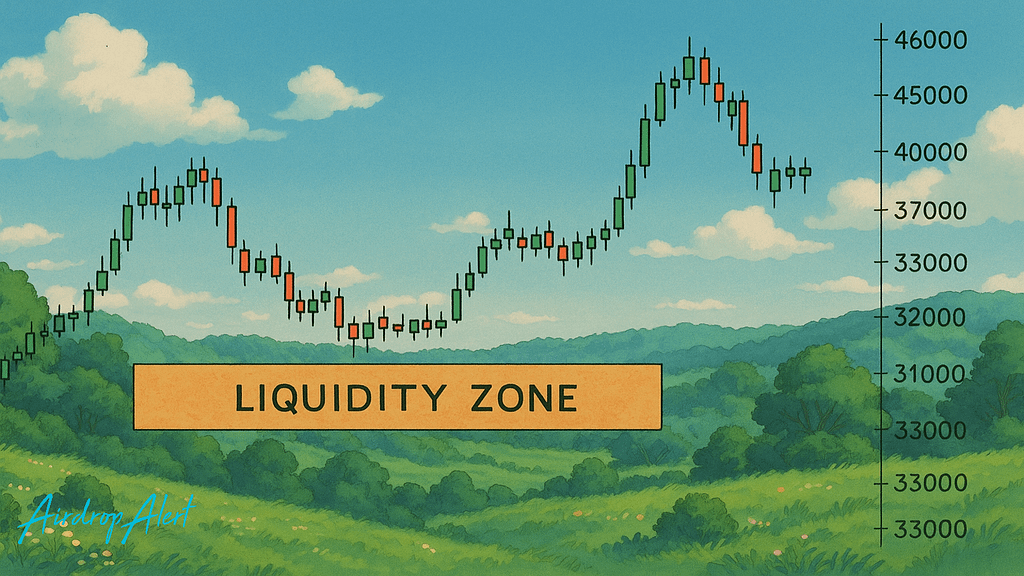
What Are Liquidity Zones?
Liquidity zones are areas on the price chart where many buy or sell orders are placed. These zones attract large players, like institutions or whales, because they need high trading volume to enter or exit positions without too much slippage.
Common Types of Liquidity Zones:
- Fibonacci Levels
Traders often set orders around Fibonacci retracement levels like 0.618 or 0.786. - Round Numbers
Psychological levels like $60,000 or $65,000 often gather a lot of buy or sell interest. - Previous Highs and Lows
Old support or resistance areas act as liquidity magnets. - Order Blocks
Zones where institutional traders previously entered large trades. - Volume Clusters
Areas with high historical volume activity tend to attract price movement again.
By spotting these zones early, traders can better anticipate price reactions.

What Is a Stop Hunt?
A stop hunt happens when the market moves just enough to trigger traders’ stop-loss orders. Once those orders are activated, it creates liquidity that bigger players can use to fill their own trades.
How a Stop Hunt Works:
- Price moves into a liquidity zone
- Stop-loss orders are triggered
- This creates a flurry of selling (or buying)
- Big players take the opposite side of those trades
- The price reverses
Many retail traders fall victim to stop hunts. The price often bounces back right after they get stopped out.
Liquidation Maps and Why They Matter
Liquidation heatmaps help visualize where traders are likely to get liquidated. These maps often align with key liquidity zones. In Bitcoin markets, they’re especially useful since high leverage is common.
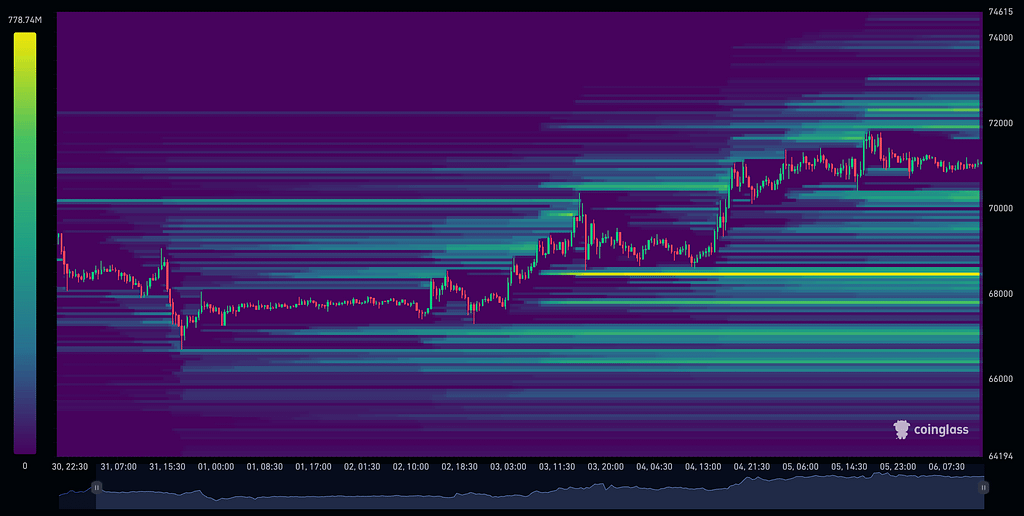
How to Read a Liquidation Map:
- Bright areas show high concentrations of liquidation levels
- Dark zones have fewer orders and less risk of manipulation
- These zones often guide where whales may push the price
By analyzing these maps, traders can prepare for potential stop hunts before they happen.
Guide on how to trade stocks with crypto
Bitcoin Example: Stop Hunt Around $60,000
Let’s imagine Bitcoin is trading at $58,000. Traders have placed long positions with stops around $60,000.
- The price pumps to $60,000
- Longs get liquidated or stopped out
- This gives whales enough liquidity to enter shorts
- The price dumps back to $57,000
If you were long with a stop at $60,000, you’d be out of the trade — just before the real move happens.
How to Avoid Getting Stop-Hunted
Here are a few practical tips to avoid falling into the trap:
1. Avoid Obvious Stop Placement
Don’t place your stop just below the last low or above the last high. Everyone does that. So, whales target it.
2. Use Wider Stops
Wider stops give you room to breathe. Just manage your position size accordingly.
3. Wait for Confirmation
Instead of jumping into a move, wait for a candle close or price rejection to confirm your idea.
4. Monitor Volume and Liquidation Zones
This helps you see where the market is likely to react. If volume spikes near a zone, stay alert.
Being aware of stop hunts can save your capital and your mental health.
How Liquidity Zones Connect to Breakouts and Gaps
Liquidity zones don’t just cause reversals. They also play a role in breakouts. If a price breaks out of a range and hits a liquidity cluster, it might fake out and reverse.
This behavior also ties into CME gaps, which often fill during low-liquidity periods. Understanding these concepts together gives you an edge in volatile markets.
Final Thoughts
Liquidity zones and stop hunts are not myths. They’re strategies used by large players to trap unsuspecting traders.
By identifying these zones and protecting your stops, you can trade smarter. Combine this with strong chart analysis, and you’ll gain an edge in Bitcoin trading.
Watch the charts. Watch the volume. And always question why price is moving.
Note: This article is for educational purposes and does not constitute financial advice.